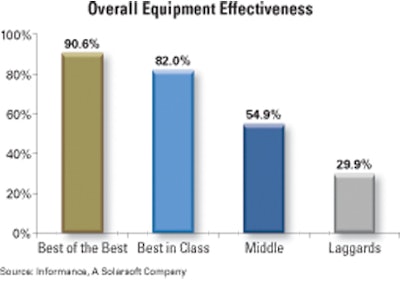
Each year Informance conducts a Manufacturing Benchmark Study, the most recent published in late 2009. Presented here are highlights of that study, which captured packaging line data from 725 consumer packaged goods manufacturing operations around the world. The time period spans January to June 2009, and accounts for 9.1 billion units of production across the 725 operations. Informance declines to identify how many unique companies are represented in the study, but the firm does indicate that it’s more than 100.
Worth noting is that the information presented here is not the result of a survey, where respondents are asked what they think their packaging line OEE is. This data comes straight from a PLC, and the sample size is large enough to make it a pretty accurate reflection of packaging line OEE at CPG companies in general.