Paper chart recorders have been around for more than 100 years, with one of the earliest examples patented in 1915 for use in environmental monitoring. The chart recorders used back then—colored pens scratching out process data onto a circular paper—are not drastically different than the charts still prevalent in food processing plants today, according to Natalee Kauffman, sales manager for Central States Industrial (CSI). “While modern-day recorders use digital sensors for more accurate reporting, the evolution of the tech has not changed remarkably,” she says.
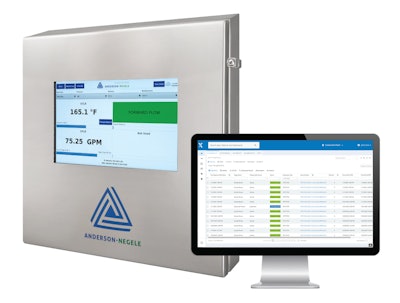
CSI is an authorized distributor for Anderson-Negele’s Paperless Process Recorder (PPR), a digital recorder system that can be used in pasteurization, clean in place (CIP), clean out of place (COP), raw silo monitoring, or any other food or beverage application that would typically use a paper chart recorder to monitor process parameters. With the Legendary cloud-based software, the records from the PPRs are securely stored in one location, enabling quality managers or other authorized users to conveniently access, review, annotate, and approve records remotely.
Kauffman joined Neil O’Connor, national key account manager for Anderson-Negele, and Nathan Collins, regional director of sales for Anderson-Negele, to explain the need in the food and beverage industry for a digital version of the traditional paper chart recorder, and also how the PPR and Legendary software work.
PFW: With as much that has changed in food processing over the past 100 years, why are these paper chart recorders still so much in use today?
Kauffman: When you think about the advancement in food processing, and the implementation of FSMA, the Food Safety Modernization Act, to think that we’re still using this tech that is from 1911 is surprising.
I think that in many cases, we’re all just victims of ‘If it ain’t broke…’ But what’s sad is that it really is broken. Paper chart recording is very time-consuming and operationally cumbersome.
Collins: What I’m seeing is that, in this industry, anytime you change something, there’s a certification process that you’ve got to change along with it. If you’ve been using paper charts for a long time, there’s an existing workflow in that process. And to suddenly change this process, it’s not just a single person that’s got to buy into this, it’s an entire company. So, what is that process for change? What are the requirements?
One of our campaign slogans is ‘It’s easy.’ It’s so easy, it really is. But it’s change. Is change really ever easy?
PFW: Help me understand how a paper chart recorder typically works.
Collins: If everything was running 100% perfect all the time, you would see what appears to be a straight line coming through on the paper chart. Then when you see a deviation in that line, that’s going to indicate a change in the operating condition. Every time you see a change in that operating condition, somebody’s got to make a manual note on the chart, explaining what the deviation is and why it happened.
A paper chart records for a period of time, let’s say 12 hours, and is taken to a quality assurance supervisor once this period lapses. The quality assurance supervisor goes through the chart and makes sure all the annotations are correct. A lot of times they’re not. If this is the case, the quality supervisor then has to take the chart back out to the line supervisor or whoever’s running the line to make the correct annotation. The quality supervisor can’t make those annotations for the operator; that’s something the operator has to do. Once the chart is fully annotated, the quality supervisor puts their stamp of approval on it. The charts are then stored away for audits. I believe they have to be stored for seven years. So you can imagine—one chart every 12 hours for seven years.
Now, what happens if you’re out collecting charts in a dairy or juice plant and you drop a chart on the floor? The ink smudges, right? The ink disappears and the chart might even tear. The workflow alone of going back through the process and getting all of these charts annotated correctly is a feat in itself. And then what happens if you’re audited? So now, I’ve got charts for seven years, and somebody wants to see what happened six months ago. What’s the process that I have to go through—storage boxes, literally storage units that somebody might have to go through to find a particular chart is an overwhelming task
Kauffman: And those are just the results of human failure. There’s lots of mechanical failure. If the pen arm breaks, if the markers don’t work, or they’re dry, then the charts are worthless. Mechanical failure is constant. Or a plant might run out of charts. Or worse, they order the wrong charts—for the wrong timeframe.
PFW: What happens with the quality manager after the paperless solution is in place?
O’Connor: Well, their life is a lot easier. With the cloud, they can actually sit at their desk, instead of walking half a mile down the line to get the piece of paper and bring it back and forth. But also they can check everything on the computer to get all the information, and they can improve the charts.
Collins: How the data is handled—and the integrity of the data—is one of the key competitive advantages that PPR offers. That’s because the processing of data is being handled by our Legendary software. This means that no one can go and change that data. It doesn’t matter what level of authorization or access you have; you cannot go back and change the data.
Kauffman: But that doesn’t mean you can’t add an annotation.
Collins: Correct. But the record is always there. Who changes that, what changes, is all documented. But you couldn’t go back and say the temperature didn’t really dip here.
Kauffman: From a food safety perspective, that’s most important—that the result is accurate and it’s not left to human interpretation.
Collins: Right. You’re not going to go back and erase the ink off of this chart and make the line smooth to cover up a potential failure in your food processing. So we need to make sure that nobody can do that digitally, either. That has a lot to do with how we handle the information and why it goes to the cloud instead of somebody’s hard drive.
The process becomes a lot easier. When a record is ready, it’s added to a queue for the quality assurance person. They look it over, and if there’s something that isn’t right on the annotation, they send that back to the PPR unit. So the operator at the unit can now make those annotations and changes and then resubmit the chart to the quality supervisor. Everything is handled digitally.
So now imagine you’re doing an audit. And instead of going out and looking for your box of stored paper charts, you just enter the date in the software and click on the respective chart. It is now in a beautifully formatted graph that you could project onto a screen or email to the client. So now audits are no longer something that you have to prepare for by organizing boxes. Instead, you can do audits in real time, essentially.
PFW: Explain how the PPR makes this process more consistent than the paper method.
Kauffman: Because you’re no longer talking about scribbles on a round piece of paper or mechanical failures. You’re no longer dealing with these mitigating factors that a person is having to read through and figure out.
Collins: Also, the annotations are on a dropdown menu, so you get a lot more consistency in those annotations. The annotations are choices rather than just writing.
PFW: What does it take to replace a paper chart recorder with the PPR?
Collins: Are you ready for this? You take the exact same sensors that you have in place with the paper chart recorders, and you connect them to the PPR unit.
PFW: No need for rip and replace?
O’Connor: This is a drop-in replacement—pull the chart recorder off, put the PPR on, plug in your sensors, then just a little bit of training with the operators on how to push the buttons because it’s all digital now.
Kauffman: One of the things that I thought was sexy about this, because change is so hard, is how well you guys did with putting a transfer box in place for users to run their old and new processes in tandem. Trust but verify, right? Especially with food safety, you’ve got to know.
O’Connor: A lot of companies are saying, ‘OK, I’m going to run my paper recorder, but I’m going to practice, I’m going to train, and then we’ll run this in parallel with it.’ So we have a transfer switch, a transfer box, and we can put that in between. So you can get all the information from the paper recorder, but this is still the main reporter. You can also switch over the information that we can see on the digital recorder, so they can train, they can play with it.
PFW: The Legendary cloud software goes hand-in-hand with the PPR, correct? Are there any concerns from your customers about the information that’s in the cloud?
Kauffman: We’ve heard the pushback for years. Plants are readying themselves for IoT [Internet of Things]; they know it’s coming. But the pushback we’ve heard for years is, ‘No, no access. No cloud. No, not in our plant. Absolutely not.’
PPR controls everything; the cloud is simply the storage for images. It doesn’t have access to the data, it doesn’t have the ability to make a change to the system, it doesn’t have the ability to do any of that.
PFW: Are customers more open than they used to be about cloud storage?
Collins: There might be some pushback to the cloud, but it’s usually not from the IT department. You’ll get it from the operators, you’ll get it from the plant manager. But once you get to the IT department, that’s a different conversation because they understand the data integrity and how secure these sites are. At that point, that’s when it becomes less of an issue.
PFW: Are there any particular industries that need PPR more than others?
Kauffman: Quite simply, if you use paper charts, you’re a candidate for this. It comes back to food safety and product quality. No one is free from the potential of a recall, unfortunately. And you have to be able to verify your processes and even locate what happened, when it happened, and what batches would have been affected. So there’s no one that is using these charts today that isn’t concerned about food safety and quality.
O’Connor: The digital workflow is one of the most important features when using PPR and Legendary software. This is how users can work the approval process in their plants. Having a digital workflow, having that all set up is at the heart of what the PPR does. Everything plants were manually doing on a paper chart recorder is what we’re doing on a digital recorder and more.
Kauffman: That’s really where the change part becomes less hard. Because you’re not doing something different. You’re still collecting the same data and performing the same process. All of those things are the same. You’re still going to annotate a chart; you’re just doing it a better and secure way.